Hey {{ first name | reader }},
How was your weekend? I have been glued to the Olympics this weekend - and it got me thinking about how tiny changes can make big differences for athletes, and digital marketers!
If you are too busy (or too scared) to look at your email numbers - you are missing insights that could improve engagement and make you more money - it’s like entering the race but never looking at your score!
So let’s dive into what the main metrics mean, and what ‘good’ even looks like (using Klaviyo’s industry benchmarks).
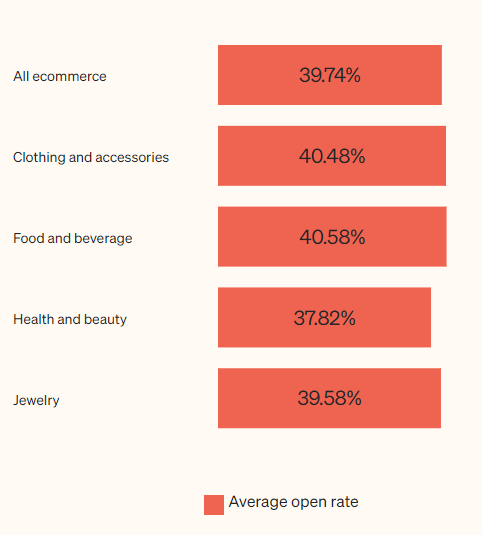
Open Rate: how do you compare?
Your open rate measures how compelling your subject lines are and how engaged your subscribers are with your brand. If you deliver value often, they are more likely to open next time.
A low open rate doesn't always mean failure. It could mean your email list needs cleaning (remove inactive subscribers) or your subject lines need to be more captivating.
Compare yourself to Klaviyo’s industry averages below:

Click-Through Rate: Gauging Engagement and Interest
This email marketing metric tracks the percentage of recipients who clicked on one or more links within your email. A healthy click-through rate suggests your content or products are engaging and relevant to your subscribers.
To improve it, focus on creating compelling calls to action and use visually appealing email designs. Remember, the key is to make it easy for people to take the desired action.

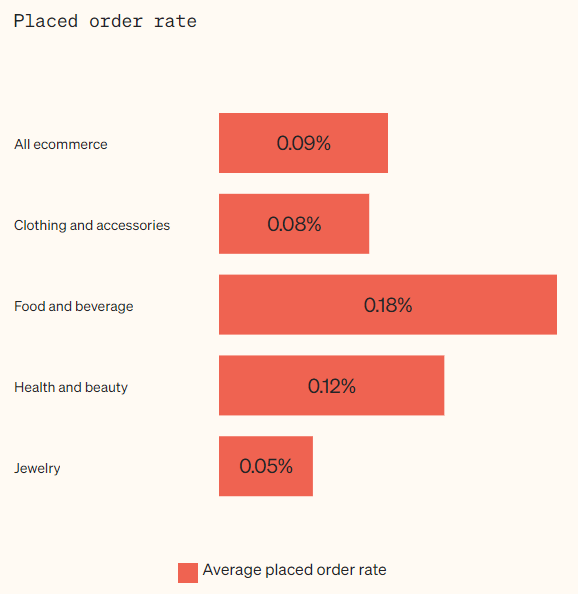
Conversion Rate: The Ultimate Measure of Success
Out of all the email marketing metrics, the conversion rate is where results are seen. This metric tells you how many recipients completed a desired action like making a purchase or signing up for a webinar.
The higher the conversion rate, the better. To improve your chances, ensure your emails are targeted and your landing pages are optimised for conversions.
Conversion rate is dependent also on your site performance, but it is still good to compare yourself.

Unsubscribe Rate: Keeping an Eye on Subscriber Satisfaction
Your unsubscribe rate indicates the percentage of recipients who opted out of your email list after receiving your email. This email marketing metric often gets overlooked but it's a critical barometer of subscriber satisfaction.
A great unsubscribe rate is less than 0.02%. A high unsubscribe rate could indicate your emails are not relevant, too frequent, or poorly timed. Consider segmenting your email list and personalising your messaging to improve subscriber satisfaction.
Bounce Rate: Identifying Email Deliverability Issues
Not all bounces are created equal. There are two types: soft bounces (temporary issues like a full inbox) and hard bounces (permanent issues like an invalid email address).
Aim for a low bounce rate (below 2%) to ensure your emails reach the inbox. Regularly clean your email list and use a double opt-in process to reduce hard bounces.
List Growth Rate: Nurturing a Healthy Subscriber Base
A healthy email list is a growing email list. Track how quickly your subscriber base expands to measure the effectiveness of your list-building efforts.
Experiment with different opt-in forms, incentives, and lead magnets to find what works best. Offer valuable content and run contests to attract new subscribers and boost your email list's growth rate.
Return on Investment (ROI): Proving the Value of Your Email Campaigns
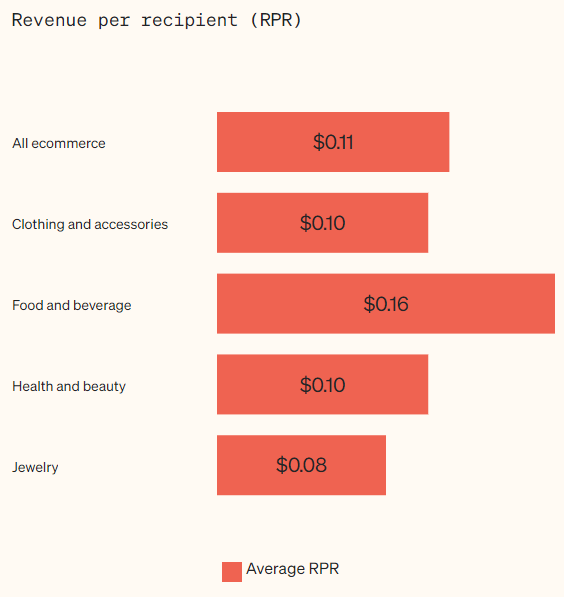
Calculating your ROI might seem complex, but here is one simple method: divide the revenue generated from your emails by your email marketing costs. This email marketing metric helps you demonstrate the value of your campaigns to key stakeholders.
A high ROI justifies your email marketing spend and provides ammunition for expanding your email marketing efforts. Use A/B testing to experiment with different email elements, such as subject lines and calls to action, and see which ones generate the highest ROI.
Another way to track your ROIs is by looking at your revenue per email recipient. See the averages for industry below, from Klaviyo.

I hope this helped demystify the numbers to look out for - and gave you some clear comparisons so you know what to work on next.
Are there any other metrics you look at regularly? Reply and let me know!
Jessie
ps. I sold my agency recently, and now I coach and consult eComm brands on their growth strategies. Visit my website to find out about ways to work with me www.jessiehealy.com

